A Quarter of Reversal: Markets & the Economy in the Second Quarter of 2026
7/16/2026 - By Michael Hall

The second quarter of 2026 will be remembered as one of the sharpest reversals in recent market memory. It opened under the shadow of a shooting war in the Middle East, a closed Strait of Hormuz, and oil trading near triple digits, with the Federal Reserve pricing out every rate cut it had once penciled in for the year. It closed with a memorandum to end that war, a reopened strait, oil in retreat, and a technology-led advance that carried the S&P 500 and the Nasdaq to their best quarter since 2020. The through line was a single macro pivot, from an energy-driven inflation shock to a renewed embrace of the artificial intelligence capital cycle, and nearly every asset class can be read through that lens.
The Quarter in Themes
Three themes framed the period. The first was a round trip in energy and geopolitics: the war that dominated the first quarter reached a negotiated pause in June, and the resulting slide in oil pulled the rug from under the inflation scare that had gripped markets in the spring. The second was the reassertion of the AI trade, which reclaimed market leadership after a February and March wobble and drove technology to a gain of more than forty percent for the quarter. The third was a hawkish handoff at the Federal Reserve, where Kevin Warsh succeeded Jerome Powell and a committee that had debated rate cuts in January now openly debated hikes. Each of these threads is developed in the sections that follow.
Equity Markets: A Tale of Two Quarters
United States equities delivered a historic three months. The S&P 500 rose roughly 14.8 percent, its best quarterly return since the second quarter of 2020 and, by one strategist's count, the fifth strongest second quarter on record. The Nasdaq Composite gained about 21 percent, and the Dow Jones Industrial Average added close to 13 percent for its strongest quarter since 2022. The path was anything but a straight line. All three major indexes set record closes on May 29, with the S&P 500 finishing above 7,580 and the Nasdaq above 26,900, before a June pullback took hold. A violent sell-off in semiconductor shares on June 5 dropped the Nasdaq more than four percent in a single session, its worst day in over a year, as a hotter-than-expected jobs report pushed the ten-year Treasury yield above 4.5 percent. Markets steadied through late June and rallied into quarter end, leaving the S&P 500 near 7,500 and up about 9.5 percent for the first half.
Beneath the index level, breadth improved in a way that should reassure diversified investors. The Russell 2000 index of small companies closed above 3,000 for the first time and finished the first half up nearly 22 percent, its best opening six months since 1991. By late June, roughly two-thirds of S&P 500 members traded above their fifty-day average, up from about half a month earlier. Leadership that had been narrowly concentrated in a handful of mega-cap names widened, even as those same names, the so-called Magnificent Seven, still advanced about eleven percent for the quarter.
Sector Rotation: Energy and Technology Trade Places
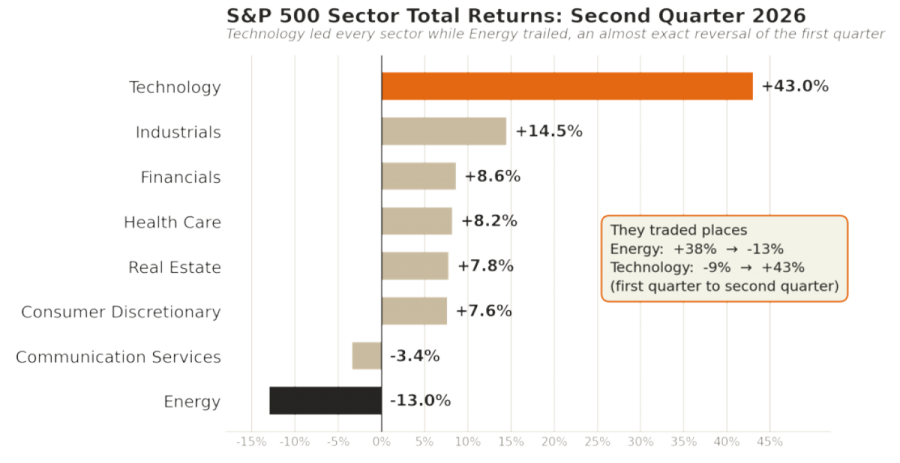
Nothing captures the quarter better than the sector scoreboard shown below, which essentially inverted from the first quarter. Energy was the runaway leader in the first quarter as oil spiked, and was the worst-performing sector in the second quarter, falling about 13 percent as crude prices collapsed on the prospect of peace. Technology, the worst performer in the first quarter, led all eleven sectors with a gain of more than 43 percent as the AI capital cycle reasserted itself. Industrials followed at roughly 14.5 percent, with financials, health care, real estate, and consumer discretionary all posting mid- to high-single-digit gains. Communication services was the only other sector to finish in the red. The lesson was that leadership can change hands quickly, and that diversification pays off.
International and Emerging Markets
International equities extended a theme that has defined 2026, a genuine broadening of opportunity beyond the United States. Emerging markets led, propelled by Asia's central role in the global AI build-out. South Korea has been the standout, with its benchmark index up 107 percent on the year. Driven by the strength of memory-chip demand from Samsung and SK Hynix. Taiwan, Brazil, and Japan also drew strong flows. A softer dollar following the June de-escalation with Iran added a tailwind to non-United States assets. That leadership was felt directly in client portfolios, where the emerging-market core strategies were the strongest-performing sleeve of the quarter by a wide margin, returning between 18 and 19 percent. For clients with dedicated international and emerging-market allocations, the first half offered a welcome reminder that diversification across geographies can add to returns rather than simply dampen volatility.
Fixed Income and Interest Rates
Bonds spent the quarter weighing out elevated inflation and a resilient economy. The ten-year treasury yield traded within the 4.0 to 4.5 percent band that has defined the past year. But yields pressed to the top of that range, reaching their highest levels since the middle of 2025 in May. It was driven by a firm read on producer prices, with the thirty-year briefly trading above 5 percent. Sticky inflation, a rising term premium, and oil's role as an inflation signal all argued for higher yields. Late in the quarter, as energy prices fell and Hormuz traffic resumed, the ten-year eased toward 4.37 percent before rebounding on a strong reading of job openings.
The practical takeaway was that income, not price appreciation, carried fixed-income returns, and shorter duration and higher credit quality were rewarded more than long-duration exposure. That pattern was visible in client portfolios as well, where the income-oriented and shorter-maturity strategies outpaced the core investment-grade allocation over the first half. Corporate credit spreads remained historically tight, offering limited additional compensation for reaching down in quality.
The Economic Backdrop
The economy that markets navigated was, in a word, resilient, but with a clear inflation problem threatened by the energy shock. Headline consumer prices rose 4.2 percent in the year through May, the first reading above four percent in three years and the highest since April 2023, driven by a 23.5 percent surge in energy costs. Yet the underlying picture was calmer than headline numbers suggested: core consumer prices, excluding food and energy, rose a more modest 2.9 percent, and core goods prices actually fell for the month, a sign that tariff pass-through stayed muted and that the inflation was concentrated in energy. The Federal Reserve's preferred gauge told the same story, with headline PCE at 4.1 percent and core PCE at 3.4 percent in May. GDP growth held up.
The final reading on first-quarter gross domestic product was revised up to 2.1 percent and the Atlanta Fed's real-time estimate pointed to growth above three percent in the second quarter. The labor market cooled at the margin without breaking, with May payrolls coming in hot at 172,000, job openings rising to a two-year high. June private payrolls softened to 98,000. A new source of inflation appeared late in the quarter: the same AI boom, lifting equities began to show up in prices. Surging demand for memory chips and a round of consumer-electronics price increases introduced the notion of AI-driven inflation.
The Federal Reserve: A New Chair and a Hawkish Tilt
The quarter marked a leadership transition at the Federal Reserve. Jerome Powell's term as chair ended in mid-May, and Kevin Warsh, took the helm. His first meeting, on June 17, produced a unanimous decision to hold the federal funds rate in its 3.50 to 3.75 percent range, where it has stood since December 2025, but the projections underneath were decidedly hawkish. The committee's dot plot flipped from implying a cut earlier in the year to implying a hike, with the median participant now seeing the year-end rate near 3.8 percent. Seventeen of eighteen officials judged the risks to inflation as tilted to the upside. Warsh also reshaped the Fed's communication, cutting the policy statement to roughly 130 words and stripping out forward guidance. The message was clear: the central bank that spent January debating how many times it would cut spent June debating whether it would need to hike. Futures markets now lean toward a single quarter-point increase later this year, with the next meeting scheduled for July 28 and 29.
Headlines That Framed the Quarter
The Iran War and the Strait of Hormuz
The macro story of the first half was written in the Strait of Hormuz, the narrow waterway through which roughly a fifth of the world's seaborne oil passes. The conflict that began in late February led to a closure and later a naval blockade. Oil surged, with Brent crude peaking above $113 per barrel during the spring. The turning point came on June 17, when the United States and Iran signed a memorandum of understanding to end nearly four months of war, reopen the strait, and begin a sixty-day negotiation toward a permanent settlement. Oil fell sharply on the news, with Brent sliding toward $70 per barrel, and by late June, tanker traffic had largely resumed. Talks will continue into July. Because energy sat at the center of the quarter's inflation scare, this single de-escalation rippled outward into lower inflation expectations, a less aggressive Fed path in the eyes of some strategists, and the sharp reversal in sector leadership described above.
The SpaceX IPO and the AI Listing Wave
The quarter's marquee corporate event was the initial public offering of SpaceX, which began trading on the Nasdaq under the ticker SPCX on June 12. Priced at 135 dollars a share, the offering raised roughly 75 billion dollars, making it the largest IPO in history, well past Saudi Aramco's 2019 record, and valuing the company near 1.77 trillion dollars. Shares closed the first day up about 19 percent and briefly pushed the company's market value above 2.2 trillion dollars.
The milestone briefly made founder Elon Musk the world's first trillionaire on paper. The debut was volatile thereafter, with shares peaking intraday above 225 dollars before settling back near 153 by late June. The stock is slated to join the Nasdaq 100 in early July. The offering matters beyond its size. SpaceX, which folded Musk's xAI venture into its business earlier in the year, is the first of an expected wave of AI-related mega-listings, with OpenAI and Anthropic also reported to have filed. For clients, the episode is best understood as a market referendum on the AI capital cycle: enormous enthusiasm for the theme, paired with real questions about valuation, given that SpaceX carried a sizable net loss even as its Starlink unit turned a profit.
Portfolio Building Blocks
The table below shows total returns for the largest holdings across Saltmarsh portfolios, organized by asset-class sleeve, with figures drawn from YCharts as of the June 30 quarter close. The directional read that follows connects these results to the market environment described in this letter.
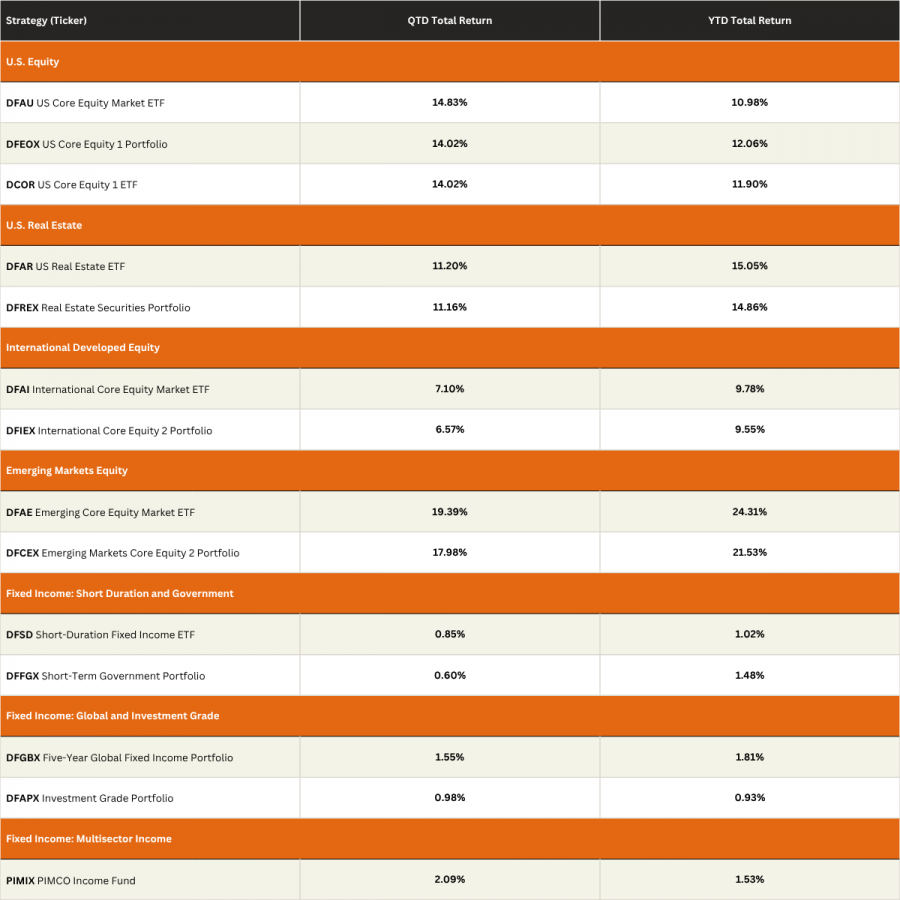
*Source: YCharts. Total returns of June 30, 2026. Quarter-to-date returns cover April 1 through June 30, 2026.
The dispersion across the book tells the quarter's story in miniature. Emerging-market equity was the clear engine, with the two core strategies returning roughly 18 to 19 percent for the quarter and 22 to 24 percent year to date, the strongest sleeve by a wide margin and a direct read on Asia's role in the AI build-out. United States core equity captured essentially the full large-cap advance, as the US Core Equity Market strategy returned 14.83 percent for the quarter, in line with the S&P 500. Our value and small-cap tilt added roughly a point and a half over the S&P 500 year to date, a payoff from the small-cap surge of the first half. Real estate was a quieter standout on a year-to-date basis, with strategies up about 15 percent. International developed equity participated but lagged its United States and emerging-market counterparts, returning about 7 percent for the quarter and just under 10 percent for the first half of 2026.
Fixed income did its job as ballast rather than engine: the multisector income strategy led at 2.09 percent for the quarter on the strength of credit income, the five-year global strategy added 1.55 percent, and the core investment-grade strategy was essentially flat, up 0.93 percent year to date, as rising yields offset its coupon. Tellingly, the shorter-maturity and government strategies outpaced core investment grade over the half, a clean confirmation that duration was a headwind in a year of rising rates. Across the book, the spread between the strongest sleeve and the weakest was more than twenty percentage points year to date. This is the strongest argument for diversification the quarter could have produced.
Looking Ahead
The central tension heading into the second half is easy to state and hard to resolve: a sticky, energy-driven inflation impulse and a Fed that has shifted from cutting to a hawkish hold on one side, and strong corporate earnings and a powerful AI investment cycle on the other. Analysts expect S&P 500 earnings to have grown more than 23 percent year over year in the second quarter, which would support valuations that sit modestly above their ten-year average. Several strategists expect the oil shock's inflationary effect to fade in the coming months as long as peace prevails. That would keep the Fed on hold rather than force a hike, though that view depends on the durability of the Iran settlement.
We will be watching four things in particular: whether energy-driven inflation recedes as the Hormuz corridor normalizes, the breadth and durability of the AI trade after its sharp June wobble, the outcome of the July 28 and 29 Federal Reserve meeting, and the second-quarter earnings season now getting underway. As always, these are estimates rather than promises, and the appropriate response to a quarter this eventful is not to chase the leaders but to hold a diversified allocation aligned to each client's plan.
Wondering what these market shifts mean for your portfolio?
From changing interest rate expectations to AI-driven market opportunities, our advisors help investors stay focused on long-term goals, not short-term headlines. Connect with Saltmarsh Financial Advisors to discuss your investment strategy and build a portfolio designed for every market environment.
This material is provided for informational and educational purposes only and reflects conditions as of June 30, 2026. It is not investment, tax, or legal advice, nor a recommendation to buy or sell any security. Past performance is not a guarantee of future results. Figures cited are drawn from the sources listed below and are subject to revision.
Data Sources
- TheStreet, “Stock Market Today,” June 30 and July 1, 2026. Quarter-end index closes and daily moves.
- Investing.com, “S&P 500 and Nasdaq post best quarter since 2020; Dow notches best H1 in five years,” June 30, 2026. Second-quarter and first-half index returns.
- Deseret News, “U.S. stock indexes on track for best quarter in years,” June 30, 2026. Quarterly index gains.
- Seeking Alpha and MSN Money, “S&P 500 caps strongest quarter since 2020,” July 1, 2026. Second-quarter S&P 500 sector performance and Magnificent Seven return.
- CNBC, “Stock market today: live updates,” June 4, June 29, and June 30, 2026. First-half returns, Russell 2000, the June semiconductor sell-off, and labor data.
- FactSet, Earnings Insight, June 2026. S&P 500 second-quarter earnings and revenue growth estimates and forward price-to-earnings ratio.
- J.P. Morgan Wealth Management and Chase, “Stock Market Returns,” May 2026, and “June 2026 Federal Reserve Meeting Key Takeaways.” Record highs, oil, and Fed commentary.
- U.S. Bureau of Labor Statistics via CNBC, Consumer Price Index report for May 2026, June 10, 2026. Headline and core CPI and energy prices.
- U.S. Bureau of Economic Analysis via CNBC, Personal Income and Outlays report for May 2026, June 25, 2026. Headline and core PCE and final first-quarter GDP.
- Board of Governors of the Federal Reserve System, FOMC statement and Summary of Economic Projections, June 17, 2026; CNBC and Fox Business coverage of the April 29 and June 17 meetings.
- Advisor Perspectives (dshort) and StockTitan, analysis of the June 17, 2026 Fed decision and dot plot.
- Trading Economics and Bloomberg, U.S. 10-Year Treasury yield, May through July 2026.
- Charles Schwab, 2026 Taxable Fixed Income Mid-Year Outlook. Yield range, term premium, and credit spreads.
- CNBC and NPR, SpaceX initial public offering coverage, June 11 and June 12, 2026. Offering size, valuation, and first-day return.
- SmartAsset and Forbes, SpaceX IPO detail, June 2026. Company financials, post-IPO price action, and Nasdaq-100 inclusion.
- Wikipedia, “2026 Strait of Hormuz crisis,” and CNBC, July 1, 2026. Conflict timeline, the June 17 memorandum of understanding, and resumed oil exports.
- Al Jazeera, oil price coverage, June 17, 2026. Brent crude levels.
- iShares and BlackRock, international investing insights, 2026. Emerging markets and South Korea leadership.
- Dimensional Fund Advisors and MutualFunds.com. Strategy names for the portfolio building blocks table.
- YCharts. Quarter-to-date and year-to-date total returns for the strategies listed, to be finalized at the June 30 quarter close.
Related Posts
- Long-Term Care Planning: Protecting Your Retirement, Your Assets & Your Family
- A Quarter of Reversal: Markets & the Economy in the Second Quarter of 2026
- Saltmarsh Financial Advisors Earns World-Class Client Satisfaction
- When Wealth Means More: The Keys to Establishing a Lasting Legacy
- Funding Liquidity Without Triggering Capital Gains
- Saltmarsh Financial Advisors Hosts Client Appreciation Night at the Ballpark in Pensacola
- Beyond the Hype: What the Coming Mega-IPOs Mean for Your Portfolio
- Introducing Our New Podcast: Integrated Wealth Perspectives
- Financial Scams are Evolving
- Saltmarsh Financial Advisors Earns World-Class Client Satisfaction
- The Final Chapter of the Estate Plan
- How to Prepare for a Spouse's Passing: Practical Steps for Peace of Mind
- What to Do After a Windfall? Steps to Financial Security
- Tax Law Impacts: One Big Beautiful Bill Act
- Saltmarsh Financial Advisors Recognized as Top Wealth Advisory Firm
- Estate Planning Essentials
- Magnifying Single-Stock Volatility
- Markets Look Forward. So Should Investors.
- Father's Day: Money Lessons Learned From Dad
- Why You May Need a Revocable Trust
- Cost of Index Reconstitution: Index & Diversification Portfolios
- Three Tips for Riding Out the Ups and Downs: Investment Trends
- Bearish Sentiment: Investment Trends
- Tariffs and Stagflation
- How Extreme was Recent Large Growth Outperformance?
- View All Articles